import numpy as np
import matplotlib.pyplot as plt
from scipy.optimize import minimize_scalar
# Define two test functions
def f1(x):
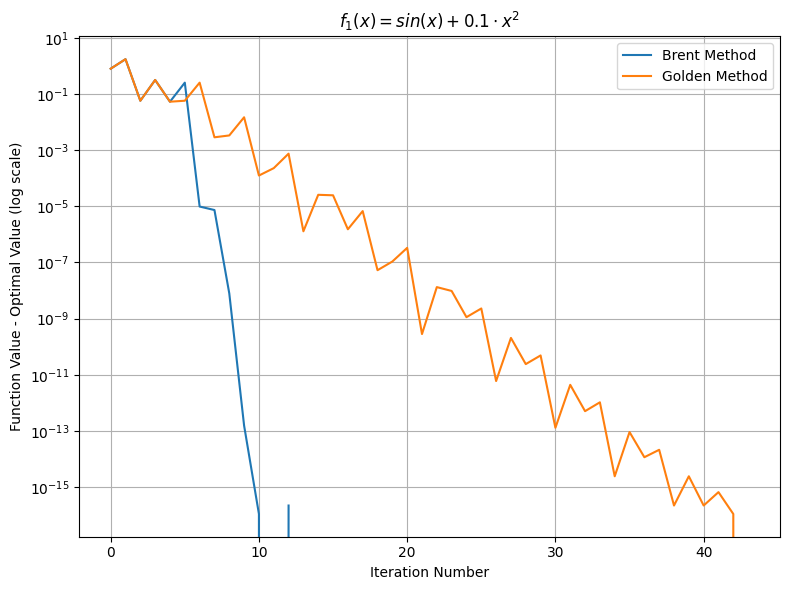
return np.sin(x) + 0.1 * (x ** 2)
def f2(x):
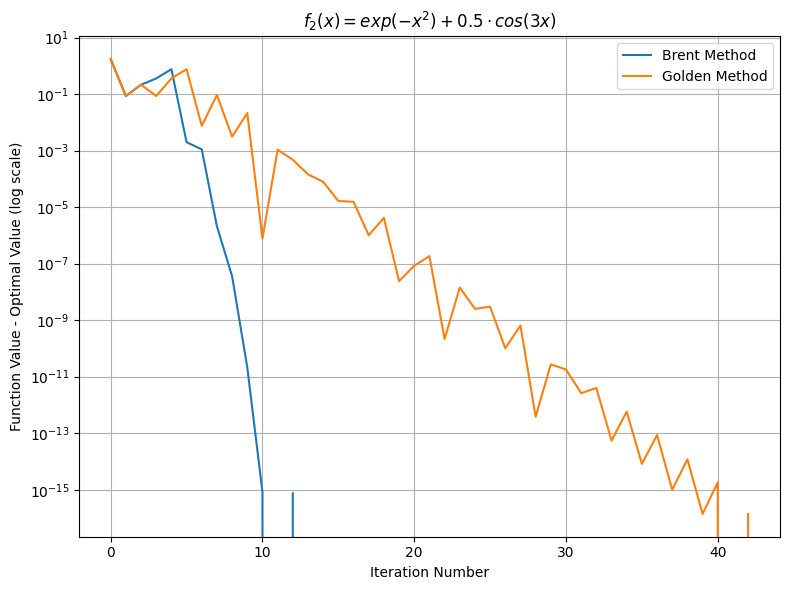
return np.exp(-x**2) + 0.5 * np.cos(3 * x)
# Optimization settings
methods = ['brent', 'golden']
functions = [f1, f2]
function_names = [r'$f_1(x) = sin(x) + 0.1 \cdot x^2$', r'$f_2(x) = exp(-x^2) + 0.5 \cdot cos(3x)$']
# Store results for plotting
results = {}
for func, func_name in zip(functions, function_names):
results[func_name] = {}
for method in methods:
function_call_values = []
# Wrap the function to track calls
def wrapped_func(x):
value = func(x)
function_call_values.append(value)
return value
result = minimize_scalar(wrapped_func, method=method)
# Collect data for plotting
results[func_name][method] = {
'function_values': function_call_values,
'num_calls': len(function_call_values),
'x_min': result.x,
'fun_min': result.fun
}
# Plot results
for func_name in function_names:
fig, ax = plt.subplots(1, 1, figsize=(8, 6))
# Plot function value vs. iteration number
for method in methods:
ax.plot(
range(len(results[func_name][method]['function_values'])),
[fv - results[func_name][method]['fun_min'] for fv in results[func_name][method]['function_values']],
label=f'{method.capitalize()} Method'
)
ax.set_yscale('log')
ax.set_title(func_name)
ax.set_xlabel('Iteration Number')
ax.set_ylabel('Function Value - Optimal Value (log scale)')
ax.legend()
ax.grid()
plt.tight_layout()
plt.show()